The Problem with Binomial Distributions in Magic
I’ve used, and have seen many others use Binomial Distribution calculators when designing magic decks, primarily for calculating how likely you are to draw a certain amount of lands. But while working on a future post involving land probability, I looked at that critically, and it’s just not correct.
First things first, what are binomial distribution calculators. A binomial distribution calculator is used to calculate the odds of a certain amount of events with a given probability happening if you try some amount of times. (Here’s a site I’ve seen used Online Binomial Calculator.) So for example, if I flip a coin 5 times, what’s the chance I hit heads 3 times.
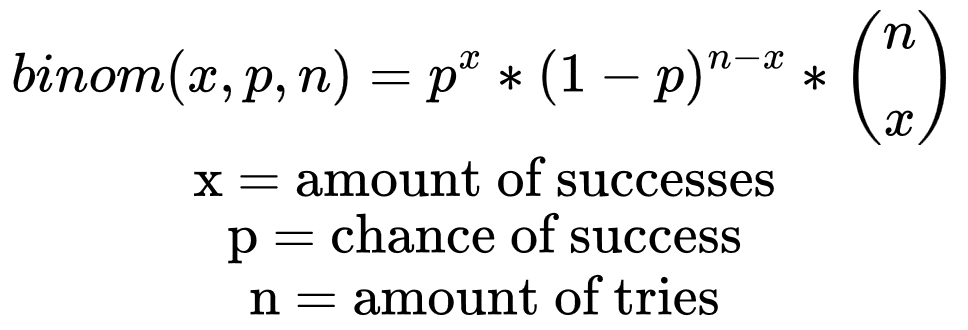
The math for these is mildly complex, the formula is:
 The
The n above x is a function in probability theory which represents n choose x, which means: how many ways can you pick n different items out of a list of r. The total function is, chance of succeeding the correct amount of times, chance of failing the correct amount of times, and then accounting for those happening in some arbitrary order1
Ok, so what’s the problem, well, it’s the p, this formula assumes that the chance of succeeding does not change, or in math terms, the trials are independent. This is not true in magic, if you draw a land, there are now fewer lands in your deck, and thus the chance of drawing another land decrease. Binomial calculators do not account for this.
So, what’s the solution? Well, it is very much possible to properly model the fact that drawing lands makes drawing lands less likely, here it is:
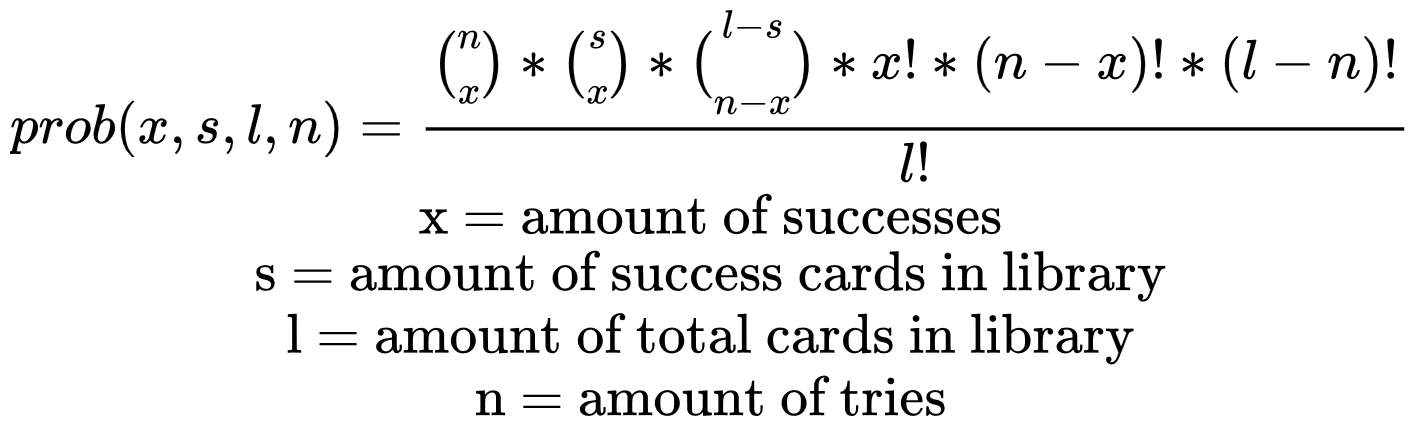 Let’s go over this in parts, overall the idea here is to see how many ways there are to arrange the library that contain x lands in the top n cards. To do this we end up dividing by the total possible ways to arrange a library, which is
 l!. All the a choose b parts in some way represent the possible ways to draw the hand, they go as follows. n choose x represents which cards in the hand end up being lands. s choose x represents which lands will be in the hand. l-s choose n-x represents which non-lands will be in our hand. Then to the factorials, these represent the order of all of our groups of cards. x! represents the order of the lands in our hand. (n-x)! represents the order of the non-lands in our hand. (l-n)! represents the order of all the cards left in our library we didn’t draw.
Well that’s a lot more complex, does the difference even matter? The answer is: somewhat. It matters more in lower deck size formats like limited than in commander, but in either case the binomial formula makes extreme outcomes (<1 or >5 lands) look more likely then they are, and median outcomes (2-4 lands) less likely than they are. In 40 cards, with 17 lands, the difference is about 9% in total. With 3 land hands having the largest error, binomial gives them a 29.4% chance, while the true chance is 32.3%. Here is a graph of the two formula, the red line is mine, the blue line is a standard binomial curve.
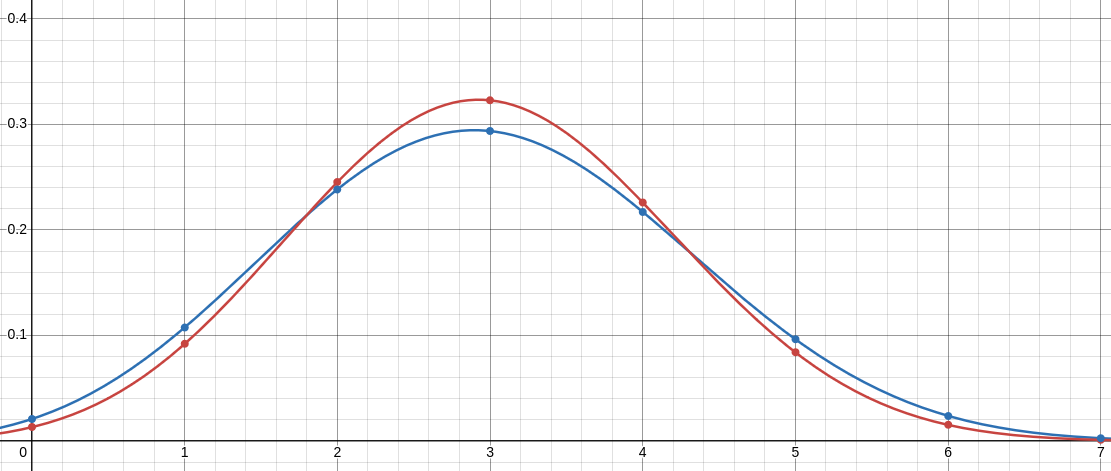
In commander this matters much less, but this formula is still more correct, the binomial curve has about a 3.4% error rate for drawing 7 cards out of a 99 card library with 37 lands. This mistake will go up as you draw more cards, so if you’re looking for the chance you draw something by turn 7 or so, it will matter a lot more.
Now, this is nice and all, but calculating this formula every time compared to just using a website for a 9% error rate is probably not worth it. That’s why I will now provide a calculator you can use, right at the end of this post. :)
s =
l =
n =
-
If you remove the nCr part it will be the chance for succeed x times in a row, then fail (n-x) times in a row exactly. ↩